
Each point on the same item name, and a constant pure substance having chemical compositions given. Water , nitrogen, helium, hydrogen, carbon dioxide, pure substance.
Not only pure chemicals should consist of a single chemical element or compound. In a mixture of different chemical elements or compounds, it is considered pure materials is homogeneous. Air is a mixture of different gases, the chemical composition is the same at every point because the pure substance and does not change.

Figure 4.1 is a pure matter and nitrogen gas atmosphere.
The oil and water mixture is considered a pure substance, as such a mixture of oil, water dissolved and do not form a homogenous chemical mixture is collected at the top.
A pure substance in a mixture of two or more phases are combined, it enters phase of the pure material scope unless there is a difference in chemical composition. Liquid vapor mixture is a pure substance, since the chemical composition is the same in both phases. In contrast fluid is not pure substances that produce gas air mixture with air, because air is different from the chemical composition of the liquid gas. This is because, the gas forming the air to have the different condensation temperatures.

Figure 4.2 Liquid water vapor mixture is a pure substance but a mixture of liquid and gas is not a pure substance.
Pure Substances Phases
Substances exist in different phase under different conditions. Copper is solid at room temperature and pressure, mercury is liquid nitrogen to gas. A substantially rigid, there are three groups, including liquid and gas phase. But it may also be another phase having a different molecular arrangement for each basic phase. For example, carbon, graphite or diamond phase of the solid phase. ice at high pressures found in seven different phases. Phase, which represents the same at every point in the physical layout of a particular molecule significantly limits.
Ice-water is a good illustrative example of the two phases of water. molecules in the solid phase is itself located in the lattice name and repeating three-dimensional pattern.
Figure 4.3 shows a rigid body forming molecules are held in place by a spring-like force between molecules.
Molecules in the solid bodies are close to each other, the forces pulling them together is stronger and therefore they remain fixed in place. the molecules in a solid body, although they remain in place, where they constantly vibrate. This speed depends on the temperature of the molecules during vibration. When the temperature increases enough clusters begin to separate molecules by superior to the forces that hold molecules here. This is the beginning of the melting point.

Figure 4.4 molecules in the solid phase is almost constant in place.
The distance between the molecules in the liquid phase is not much compared to the solid phase, but no longer molecules slide over each other in sets rather than remain fixed in place. However, the structural arrangement within each cluster and molecule destroying maintain their location relative to each other.

Figure 4.5 molecular clusters in the liquid phase flows through each other.
Molecules in the gas phase are well distanced from each other. not to mention the structural layout.The gas molecules are in a random manner and continuously collide with each other and with the wall of the container in which they exist. The energy levels of molecules in the gas phase is quite high compared to those in liquid and solid phases. Thus gas or froze down yoğuşurk environment has to give large amounts of energy.

Figure 4.6 in the gas phase molecules are in a random manner.
Phase Change Processes of Pure Substances
Pure substances are frequently encountered in the case where a combination of two phases. A water boiler or steam power plant in the condenser is available as a liquid vapor mixture. refrigerant refrigerator refrigerant becomes a vapor from the liquid.
Compressed Fluid
Consider of 20 ° C and a piston-cylinder assembly with the water in the 1 atm pressure (Figure 4.7).In these conditions, water and compressed fluid is a liquid phase is called. These terms indicate that yet come to the stage of evaporation of water. Perpetuate until the water heating 40 ° C. During this process, the water expands slightly increases the specific volume. 1ATM at this pressure remains constant during expansion, because the change in atmospheric pressure and piston weight. In these conditions, the water is compressed into a liquid because evaporation has not yet begun.

Figure 4.7 1 atm pressure and the liquid phase is water at 20 ° C. (Pressurized liquid)
Saturated liquid
If the increase in temperature, maintaining heated water will continue until 100 ° C. (Figure 4.8). At this point the water is still liquid, but the smallest heat transfer even after this point would turn to steam a quantity of fluid. In other words, the phase change is about to begin. Evaporation starting with this condition, known as saturated liquid. Therefore, it is the second state of saturated liquid.
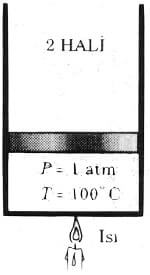
Figure 1 is 4.8 atm pressure and liquid vapor pressure of water at 100 C (saturated liquid).
Saturated steam
After evaporation starts, all the liquid will be an increase in temperature until it turns to steam. In other words, during the change of state including the phase change temperature all will be fixed.These operations must be at a constant pressure.
Returning to the piston cylinder arrangement, in the middle of the evaporation process, half of the cylinder will be liquid and vapor. (Figure 4.9), the third state, if the heating process were continued, all of the liquid becomes vapor.

A portion of the saturated liquid evaporates when heating is maintained Figure 4.9. (Saturated liquid vapor mixture).
If the heating process is carried out, and all the liquid turns into steam. Figure (4.10). 4 form. This point is at full steam on the border of the condensation inside of the cylinder. Although the environment in less heat transfer from the steam to condense some steam (steam to turn into liquid) lead. this vapor condensation on the border with saturated steam name is given.

Figure 4.10 1 atm pressure until the last drop of the liquid had evaporated, the temperature remains constant at 100 ° C (saturated vapor).
Superheated Steam
Wherein if after all the water at 100 ° C cylinder temperature and the residue evaporates heating process were continued to be observed in the specific volume. (Figure 4.11), the temperature of the vapor in 5 may for example be 300 ° C. In this case, we take a little heat from the steam temperature drops, but not condensation. limit non-condensing steam is called superheated steam.

Figure 4.11 Heating If maintained, the temperature of the steam begins to rise (superheated steam).

Diagram 4.1 show in the TV diagram of water heated under constant pressure.
Saturation Saturation Temperature and Pressure
Boiling temperature at which the saturation pressure of a pure substance at a given temperature is defined as T saturation. Similarly, at a given temperature, the pressure starts to boil the saturation pressure of a pure substance is defined as P saturation. 101.35 kPa pressure saturation temperature of water is 100 ° C. Naturally the water saturation temperature is 100 ° C at the saturation pressure of 101.35 kPa.
As clearly shown, the phase change temperature during a change of state occurs, and the pressure of connected features. T saturation = f (P saturation) is. The saturation temperature of the saturation pressure curve, which changes according to the liquid-vapor saturation curve is called. curve diagram showing the relationship to water is given in 4.2. liquid-vapor saturation of all pure substances, especially warping shows similar.
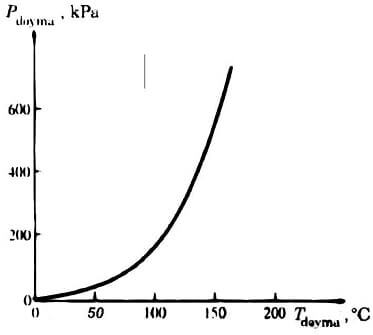
Diagram 4.2 Pure substance liquid-vapor saturation curve (numerical values for water).
Diagram 4.2 when analyzed, i.e. it increased the saturation pressure in the pressure no longer increases the saturation temperature of the boiling point temperature.
Atmospheric pressure and thus the boiling temperature of water decreases with height. In this regard, if the pressure cooker is used, the food cooking time will be longer in high places. altitude variation of the boiling temperature at atmospheric pressure and water is shown in table 4.1. Each 1000m boiling temperature decreases to approximately 3 ° C increase in height.

Table 4.1 Standard atmospheric pressure and water boiling (saturation) altitude change of temperature.
Critical Temperature
The saturated vapor saturated liquid is defined as where the state is the same. Its temperature at the critical point of a substance, pressure and specific volume values were critical temperature T cr, the critical pressure P cr and critical specific volume, V k is called. Critical value for Water T k = 374.14 ° C, P k = 22.09 MPa and V k = 0.003155 m 3 / kg.
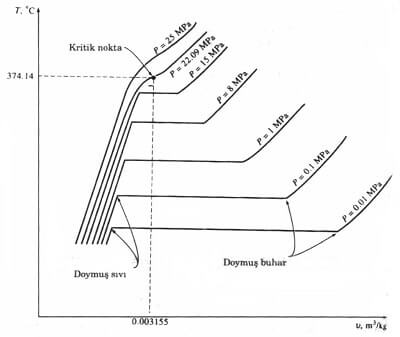
Diagram 4.3 TV diagram of a pure substance is a phase change to a different pressure curve (Numerical values are for water).
a distinct phase change at pressures above the critical pressure is not observed. (Diagram 4.3) specific volume of material Instead, it has increased steadily and consistently the same phase.Substances usually superheated steam at temperatures above the critical temperature, called the compressed fluid substance at temperatures below the critical temperature.
When the saturated liquid state diagram showing the 4.3 dots are connected to obtain the saturated liquid curve. Similarly, the saturated steam curve can be drawn by combining the saturated vapor states. As shown in this diagram two curves merge at the critical point 4.5 to form a dome. All states of the compressed fluid is to the left of the saturated liquid curve. This area is called the compressed liquid region. All superheated steam region remains the right of the saturated vapor curve. This region is given a name of superheated steam. This substance is only two of the liquid or vapor phase. Both phases together beneath all of the cases where the balance of the dome, is of liquid-vapor mixture of saturated or wet steam region called.
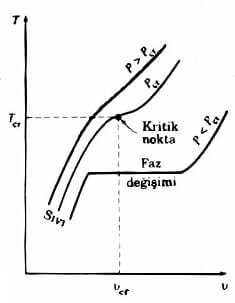
4.4 diagram pressures above the critical pressure (P> P C) is a distinct phase change (boiling) is not a process.

TV diagram of the diagram 4.5 Pure Substances
PT diagram of a pure substance
This diagram is commonly known as the phase diagram, because it is separated by a curve in all three phases together. Sublimation curve of separating the solid and vapor, melting curve separates the solid and liquid regions. These three curves meet in the triple point where all three phases together in the balance. Evaporation curve ends at the critical point. Because the liquid above the critical point and can not distinguish between vapor phases.

Diagram 4.6 PT diagrams of pure substances
Source: Inst. See. Orhan KISA